2023-2024 Student Demographic Survey

The DCDSB Student Demographic Survey was conducted between April 22-26, 2024. The survey included all students from Kindergarten - Grade 12. Parents/guardians of students in Kindergarten - Grade 8 completed the survey on behalf of their children. Students in Grade 9-12 were invited to complete the survey during class time.

View the Student Demographic Survey Infographic

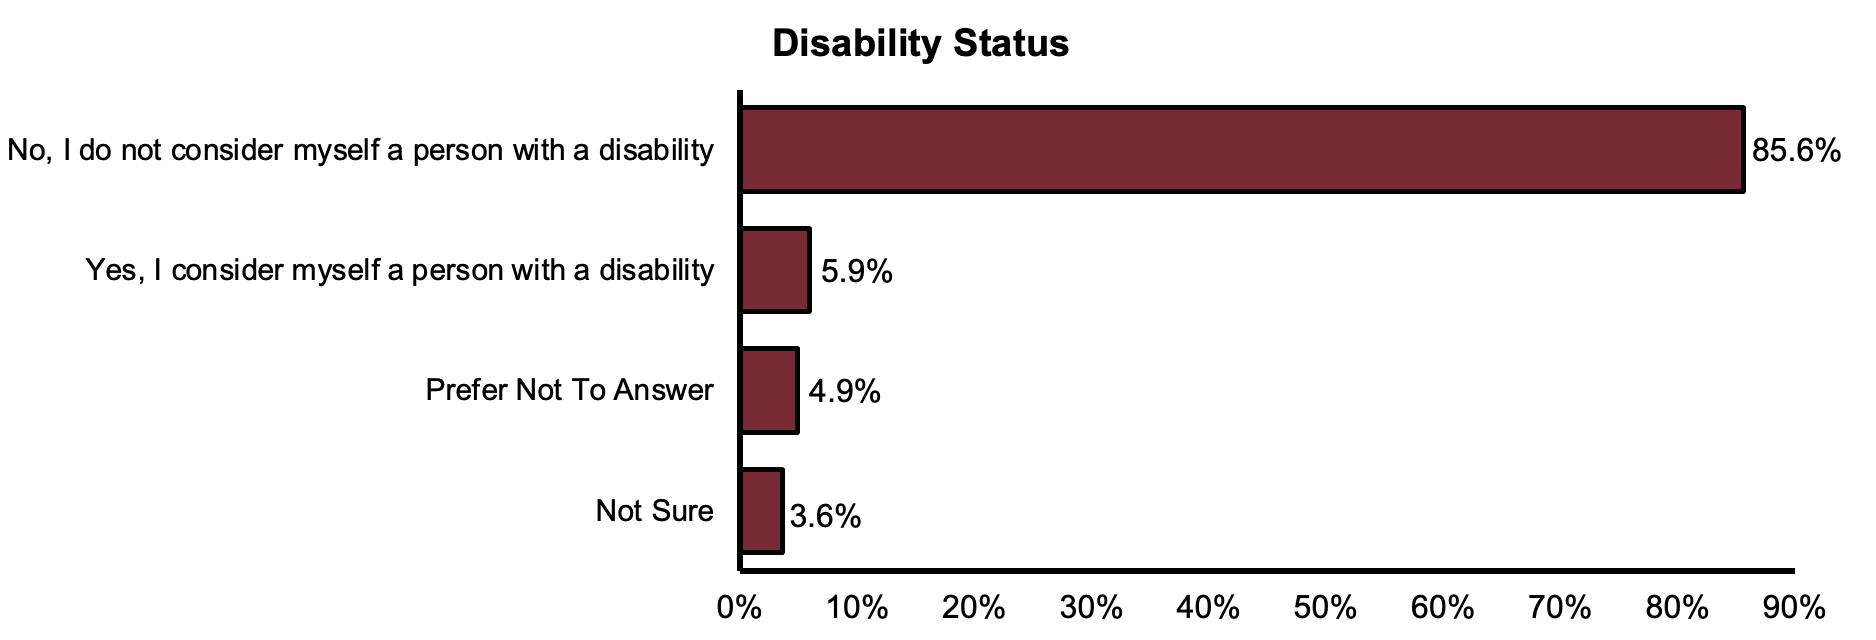
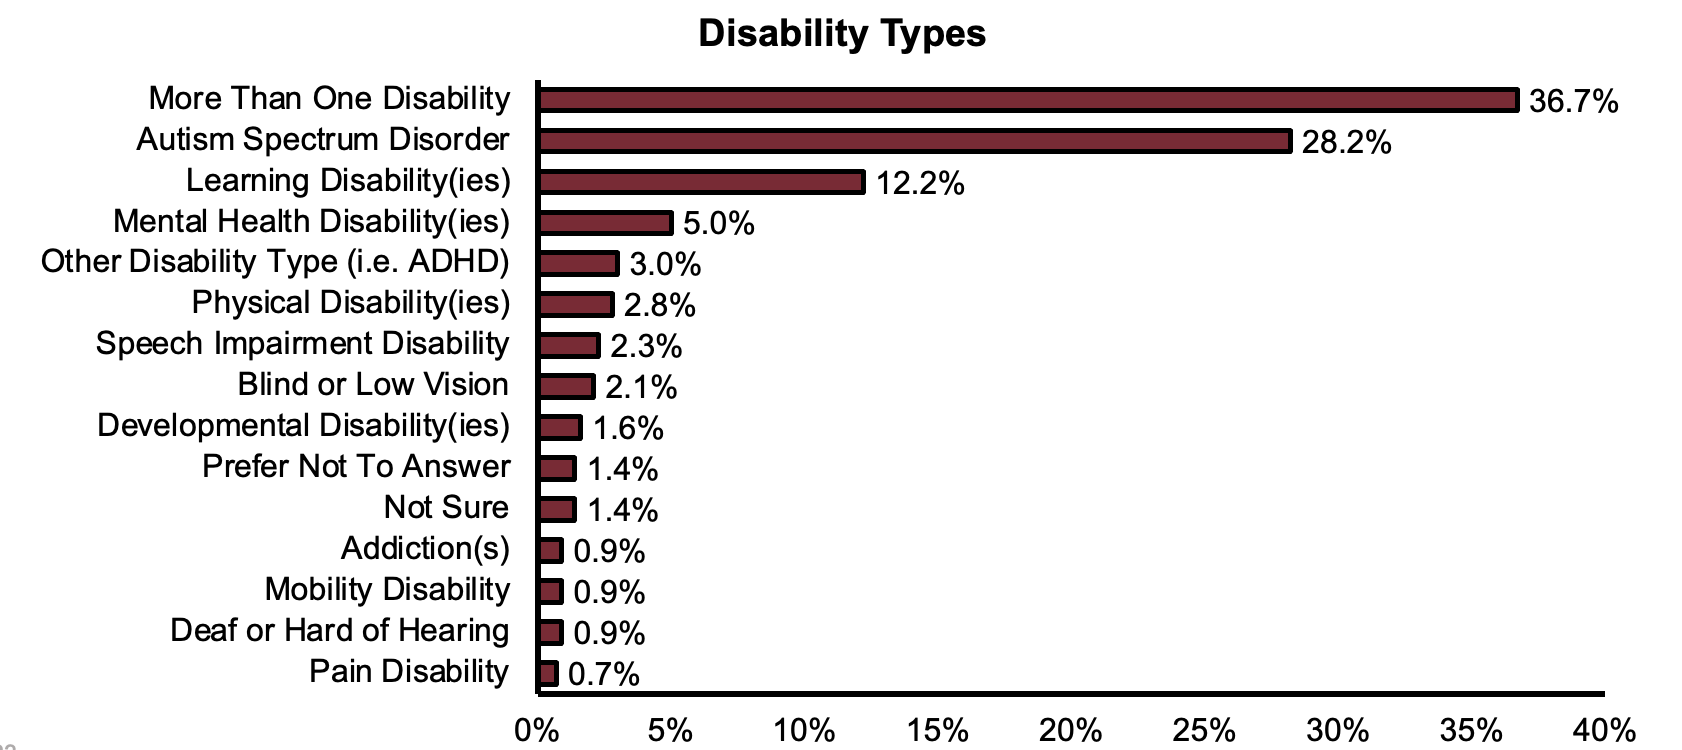
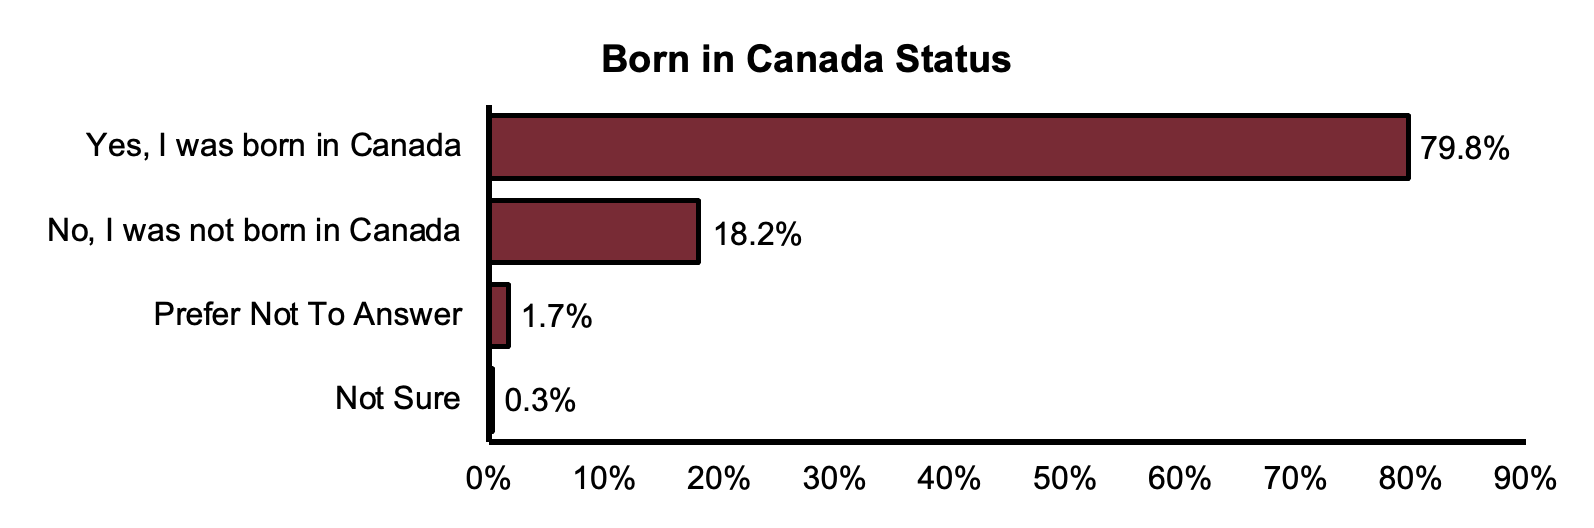
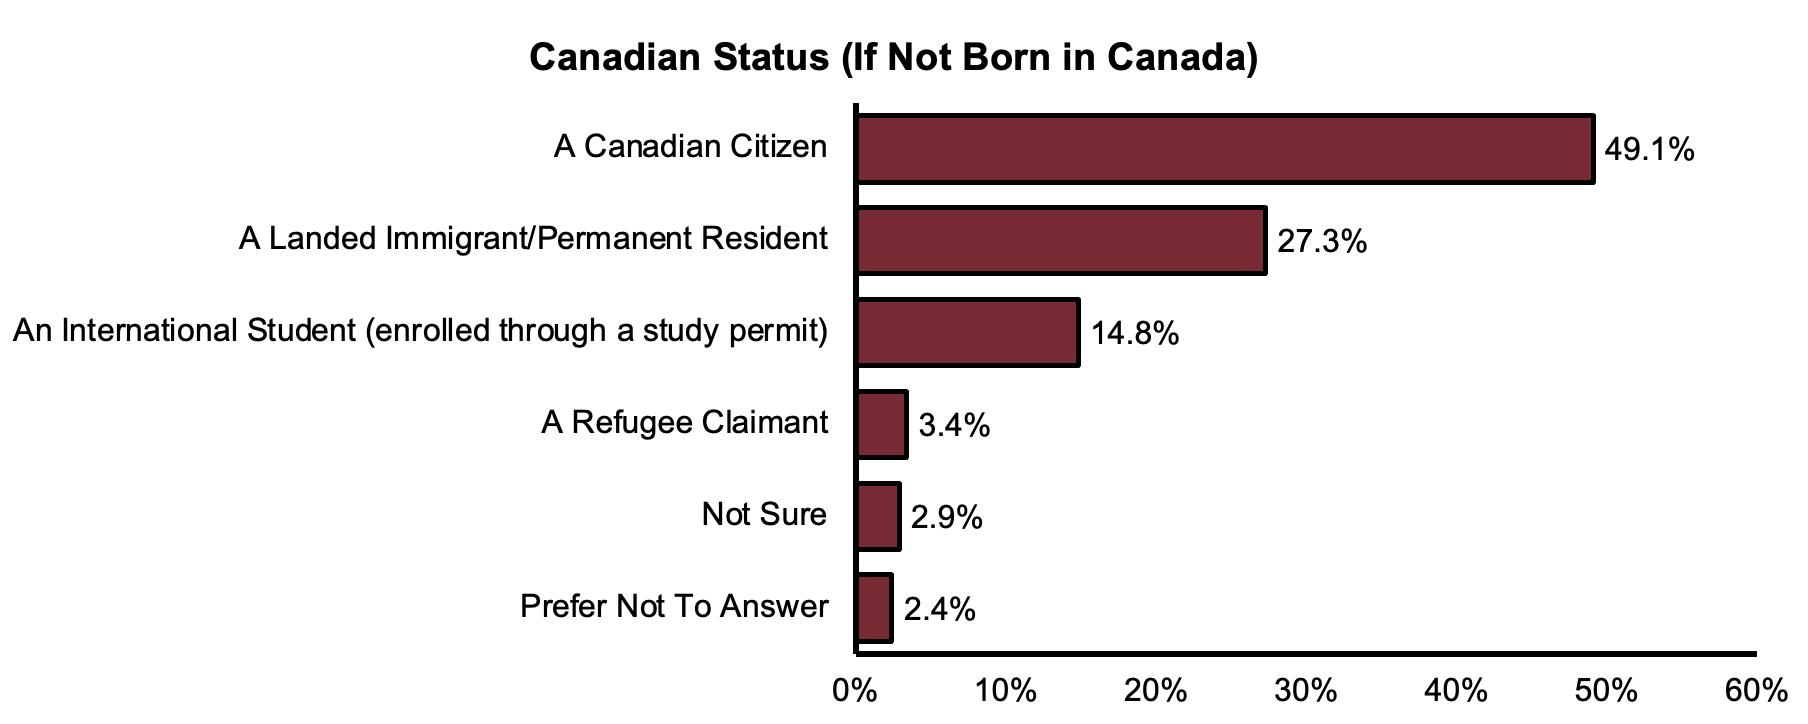
The Student Demographic Survey offered students an opportunity to share information about their identities related to the protected grounds of the Ontario Human Rights Code (OHRC). The voluntary survey collected confidential student demographic data that will enable DCDSB to better understand our students, and to inform plans to improve student achievement and student success.


The content of the survey was guided by the Anti-Racism Data Standards. The survey helps to meet our obligations related to planning and monitoring the annual Student Achievement Plan, mandated by the Ministry of Education under the Better Schools and Student Outcomes Act, 2023. The survey will allow the board to identify, monitor and address:


  • disproportionalities with respect to student course enrollment, suspensions, expulsions and exclusions, and special education programs and services; and 
  • disparities with respect to student achievement, well-being and sense of belonging.

About the Survey

The Anti-Racism Act, 2017 and Ontario's Education Equity Action Plan, require school boards across the province to collect student identity-based data to identify barriers, gaps, and determine how to eliminate discrimination and biases in our classrooms and schools.  

In order to ensure every student can reach their full potential, we need to align resources and supports with student needs. Collecting demographic data allows the board to better analyze the trends and patterns in student achievement and student success. This information enables the board to evidence-based and informed decisions about resource allocation and supports.

The survey questions are guided by the Anti-Racism Data Standards established through the Anti-Racism Act. The questions were developed to support data collection and to ensure consistent practices across boards of education in Ontario. 

The two perceptual questions about students' sense of representation were developed and are consistent with the 2021-2022 DCDSB Student Census questions, and are intended to help the board collect data to inform plans required by the Ministry of Education. 

It is the mission of the Durham Catholic District School Board (DCDSB) to be an inclusive Catholic learning community that inspires every student to achieve their full potential through faith and education.

In order to ensure every student can reach their full potential, we need to align resources and supports with student needs. Collecting demographic data allows the board to better analyze the trends and patterns in student achievement and student success. This information will enable the board to make evidence-based and informed decisions about resource allocation and supports.

Response Summary

The following response summary is separated by question. The data shared should be interpreted with the following understanding:

  • 7,389 Student Demographic Surveys were completed by students and/or their parents, approximating a 33% participation rate of the entire DCDSB student population (out of approximately 22,727 eligible students in Kindergarten - Grade 12 in the 2023-2024 school year)
  • Out of the 7,389 submitted surveys, 3,461 (47% of submitted surveys) were completed by parents of students in Kindergarten - Grade 8, while 3,928 (53% of submitted surveys) were completed by Grades 9-12 students themselves.
    • 3,928 surveys were submitted out of 6,858 eligible secondary students, which accounts for an overall completion rate of 57% of all Grade 9-12 students in the board.

  • Across the municipalities the board serves, the rates of participation break down as follows (out of 7,389 participating students/parents): Whitby (32.9%); Oshawa (23.9%); Pickering (21.2%); Ajax (20.3%); Uxbridge (1%); Scugog and Brock (0.4%).

  • Question: What is the first language(s) you learned to speak as a child? Select all that apply.
  • Response Summary: 67.9% of students surveyed are English-speaking only; 18.2% speak more than one language; proportion of bilingual speaking students (English and French) sits at 3.4%

First Language Table by Percentage

  • Question: Do you identify as First Nations, Métis, and/or Inuit? If yes, select all that apply.
  • Response Summary: 1.9% of students surveyed self-identity as Indigenous (First Nations, Inuit and/or Métis)

Indigenous Status by percentage

  • Question: What is your ethnic/cultural origin(s)? Specify as many ethnic or cultural origins as applicable.
  • Response Summary: No Ethnicity Reported (32.7%); South Asian, East Asian or Southeast Asian (19.7%); European (17.5%), and Canadian/North American (10.9%)

Ethnic or Cultural Origins by percentage

  • Question: Which racial group(s) best defines you? Select all that apply. 
  • Response Summary: White/Caucasian (29.6%); Black (21.4%); and Southeast Asian (13.9%)
  • Note: The aggregate data is presented below. The use of “Any” preceding the racial groups denotes that the % is the combination of the race by itself, the race + another race, and the race + White


 Race Groupings by Percentage

  • Question: What is your religion and/or spiritual affiliation? Select all that apply. 
  • Response Summary: Catholic (69.8%); Christian – Non-Catholic (10.8%); and Atheist (3.6%)

Religious or Spiritual Affiliation by percentage

  • Question: What is your gender identity?
  • Response Summary: Female (Woman/Girl) (48.4%); Male (Man/Boy) (46.4%); and Gender Diverse (0.4%)
  • Note: the response options for this question were: Female; Male; Prefer to Specify; or Prefer Not to Specify. The response summary listed below is taken from the answers.


Gender identity by percentage

  • Question: What is your sexual orientation? Select all that apply.
  • Response Summary: Straight/Heterosexual (72.7%); 2SLGBTQ+ (10%)
  • Note: The following graph contains aggregate data, where 2SLGBTQ+ is a compilation of all responses that indicated Bisexual, Pansexual, Lesbian, Gay, Queer, Two-Spirit, Other Sexual Orientation


Sexual Orientation by percentage

  • Question: Do you consider yourself to be a person with a disability(ies)? Select one answer only.
  • Response Summary: 85.6% of respondents do not identify as having a disability; 5.9% identify as having a disability; Learning, Autism and Mental Health Disabilities comprise top three identified disabilities.
Disability Status by percentage


  • Question: If you said “Yes, I do consider myself a person with a disability”, select all that apply.
  • Response Summary: The 5.9% of students who identify as having a disability (436 students of 7,389) were then asked to identify which disability(ies) they identify as having. Of the responses received, 36.7% identify as having more than one disability; 28.2% identified as having Autism Spectrum Disorder; 12.2% identified as having a learning disability(ies). 

Disability Types by percentage

  • Question: Were you born in Canada?
  • Response Summary: 79.8% of respondents indicated they were born in Canada; 18.2% of respondents indicated they were not born in Canada. 

Born in Canada Status by percentage

  • QuestionIf you were not born in Canada, what is your status in Canada?
  • Response Summary: 49.1% of respondents selected Canadian Citizen; 27.3% of respondents selected Landed Immigrant/Permanent Resident; 14.8% of respondents selected International Students (enrolled through a study permit); 3.4% of respondents selected Refugee Claimant.

Canadian Status (if not born in Canada) by percentage

  • Question: Who is/are the adult(s) you/your child(ren) live with most of the time? Select the option that best describes you.
  • Response Summary: 73.8% of students surveyed live with two parents; 8.3% live with one parent; 7.1% live with parent(s) and other adult family members (e.g. grandparents, aunt, uncle, etc.); 5% live part of the time with each parent.

Students' Living Situation by percentage

  • Question: Based on your survey responses, do you see yourself/your child(ren) represented in your/their learning through the curriculum and resources?
    Response Summary: 33.8% of students surveyed indicated Sometimes; 23.1% Frequently; 22.4% Always; 7.7% Never.

Representation in Curriculum and Resources


  • Question: Based on survey responses, do you see yourself/your child(ren) represented in your/their learning through the classroom and school environment?
  • Response Summary: 32.5% of students surveyed indicated Sometimes; 25% Always; 24.5% Frequently; 6.4% Never.


Representation in the Classroom and School Environment

Reports and Infographics

  • Click here to view the full 2023-2024 Student Demographic Survey report, including an in-depth analysis and comparison to the 2021-2022 Student Census.
  • Click here to view a comparative analysis of the 2021-2022 DCDSB Student Demographic Survey and the 2023-2024 Student Demographic Survey.
  • Click here to view the infographic summary of the 2023-2024 Student Demographic Survey findings.

If you require these materials in an alternate format, please contact DCDSB Communications at Communications@dcdsb.ca.