
As part of our commitment to equity and inclusion, the Durham Catholic District School Board conducted a student census in April 2022. The Stand Up, Be Counted, Be Heard Student Census was a voluntary survey that offered students in Grades 4 to 12 an opportunity to share their identities, cultures, race, ethnicities, gender, and abilities.
2021-2022 Student Census
Stand Up, Be Counted, Be Heard Student Census
The Stand Up, Be Counted, Be Heard Student Census was conducted in April 2022, and collected quality and confidential student demographic data that will enable evidence-based decision making, while helping to remove barriers to student success.
Our goals were to:
-
Understand and support the diversity of students and families;
-
Eliminate barriers to student success;
-
Enrich students’ learning by providing the right supports, at the right time, while making schools a safer, more welcoming space to belong to.
Student Census Information
When was the census conducted?
School boards across Ontario are required by Ontario’s Education Equity Action Plan and Anti-Racism Act, 2017 to gather and report identity-based data by 2023.
The student census was conducted to help the DCDSB understand and support the diversity of students and their families. The data obtained will help to eliminate barriers to student success, enrich students’ learning by providing the right supports at the right time, and will make schools safer, more welcoming spaces.
The data collected from the student census will be used to help us better understand the composition of the DCDSB student population as the Durham Region continues to grow. We will also use census data to produce reports on student achievement, programs, supports and activities at our schools.
School boards are responsible to use the student census data to see if there are any over or under-representations of student groups in specific areas of programs or services. Student census data is used to reveal trends or gaps within our system leading to actions for improving school climate, enhancing learning environments and removing barriers for equal opportunities and outcomes.
How were the questions developed?
The questions on the DCDSB student census were provided under the Anti-Racism Data Standards established through the Anti-Racism Act. The census questions were developed to support school boards in their data collection and to ensure consistent practices across the province. With the exception of two questions, all questions were mandated by the Ministry of Education. The additional questions were developed to help the Board with data required to complete the Ministry of Education mandated Student Achievement Plan and Equity Action Plan.
Response Summary
The following response summary is separated by question. The data shared should be interpreted with the following understanding:
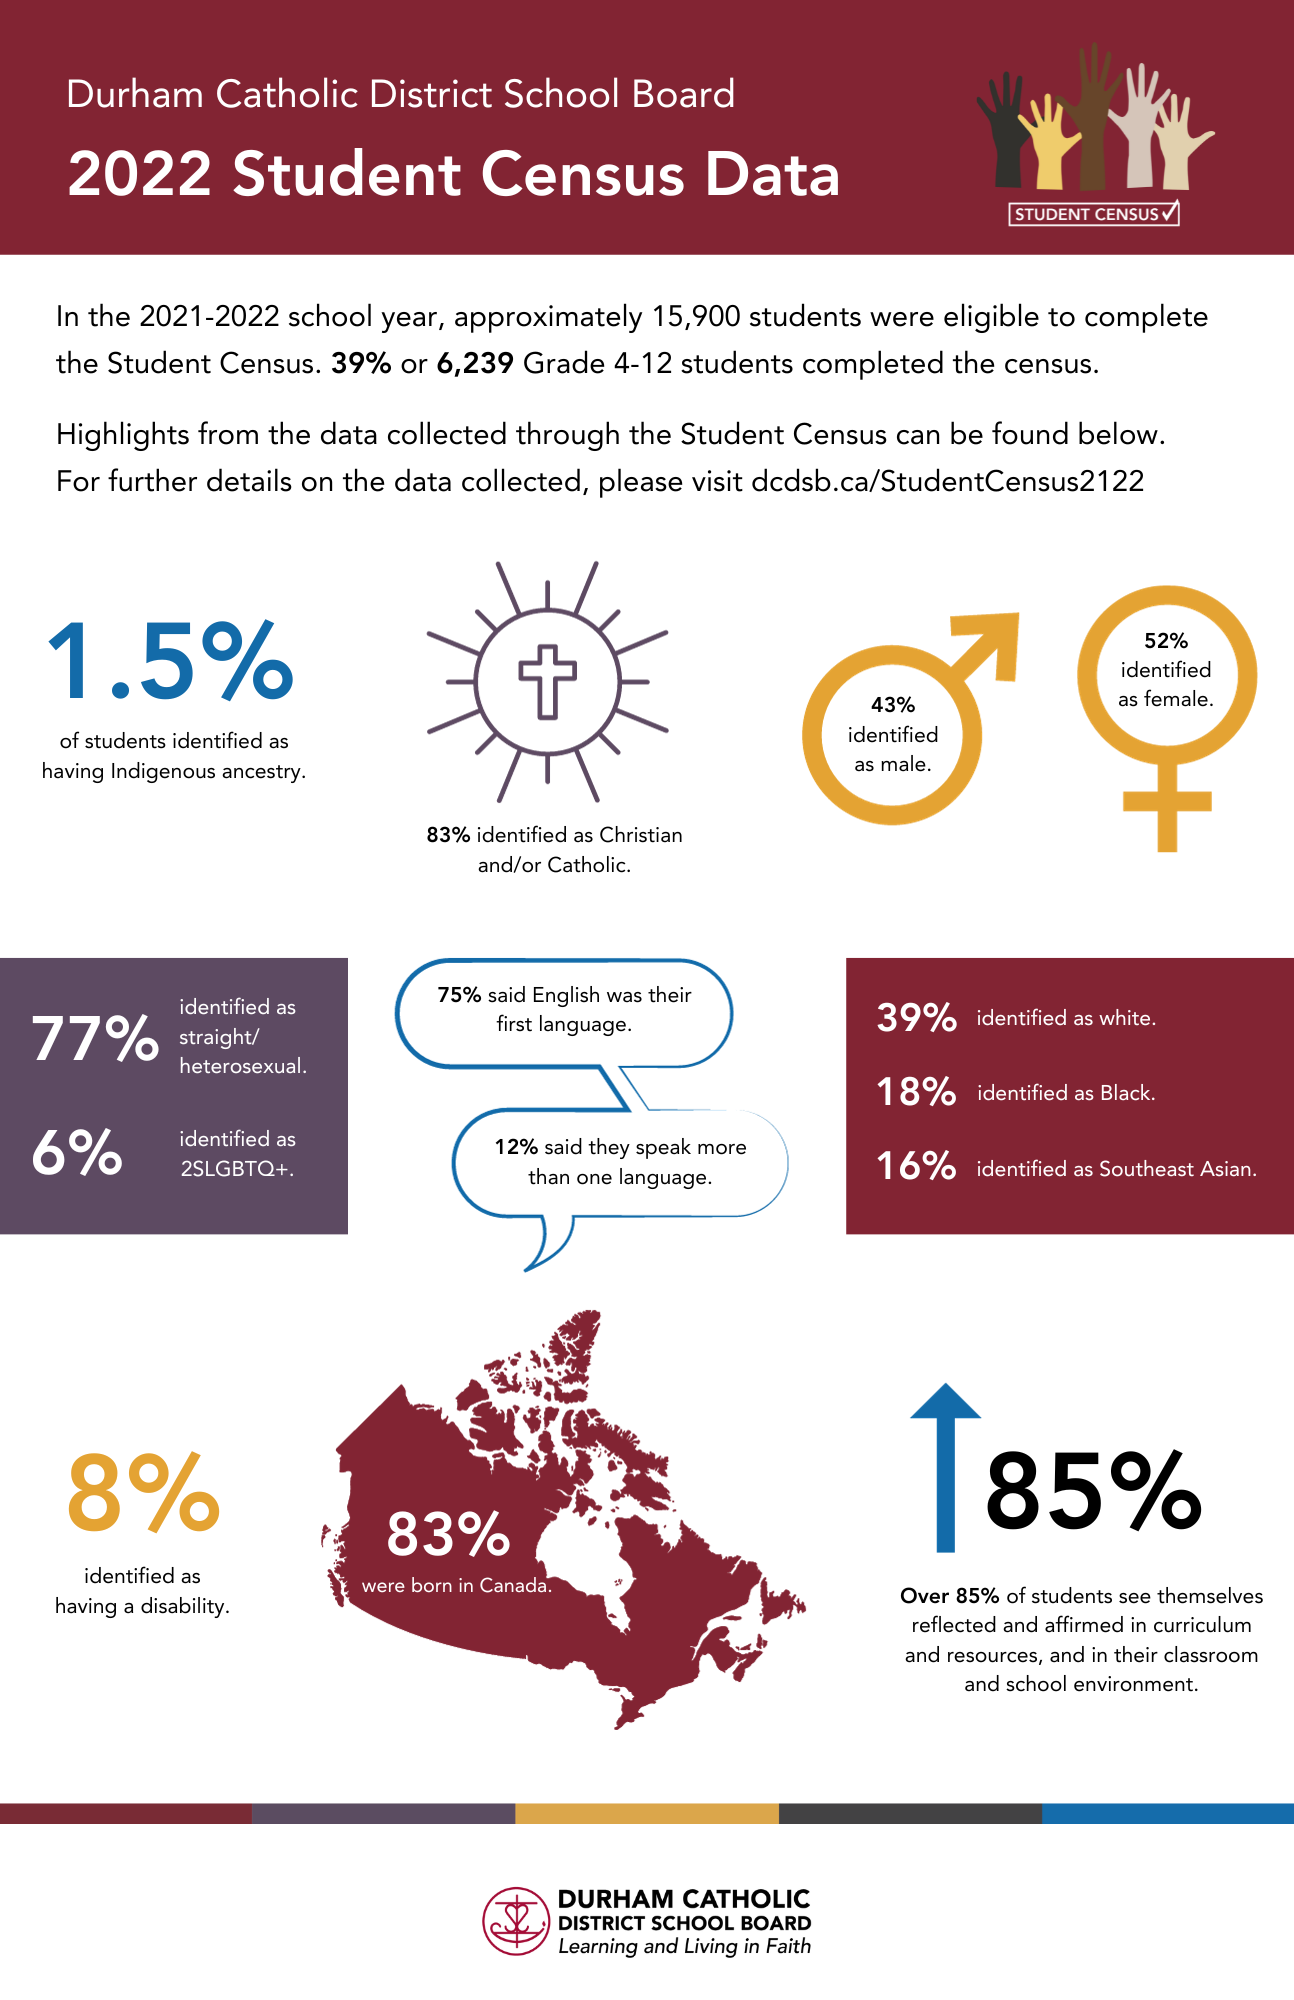
- 6,239 students completed the Student Census, approximating a 39% participation rate of the entire DCDSB student population (out of approximately 15,900 eligible students in Grades 4-12 in the 2021-2022 school year).
- Out of the 6,239 DCDSB students who completed the Census, 63.3% (3,947) of those who completed were Grades 4-8, while 36.7% (2,292) of those who completed were Grades 9-12.
- Across our Family of Schools, the rates of participation break down as follows (out of 6,239 participating students): Whitby (30%); Ajax (25%); Oshawa (20%); Pickering (18%); Brooklin (4%); Uxbridge (2%); Scugog and Brock (1%).
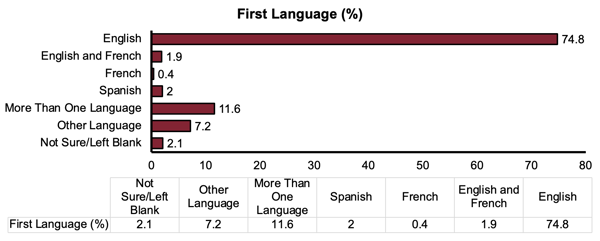
- Question: What is the first language(s) you learned to speak as a child? Select all that apply.
- Response Summary: 75% of DCDSB Census students are English-speaking only; 12% speak more than one language; proportion of Spanish-speaking students exceeds French-speaking students (2% to 0.4%)
- Question: Do you identify as First Nations, Metis, and/or Inuit? If yes, select all that apply.
- Response Summary: 1.5% of DCDSB Census students self-identity as Indigenous.

- Question: What is your ethnic/cultural origin(s)? Specify as many ethnic or cultural origins as applicable.
- Response Summary: Multiple Ethnicities (25%); South Asian, East Asian or South-East Asian (20%), and European (15%)

- Question: Which racial group(s) best defines you? Select all that apply.
- Response Summary: White/Caucasian (39%); Black (18%); and South-East Asian (16%)

Religious or Spiritual Affiliation
- Question: What is your religion and/or spiritual affiliation? Select all that apply.
- Response Summary: Christian + Catholic (71%); Christian (12%); and Questioning/Not Sure (7%)

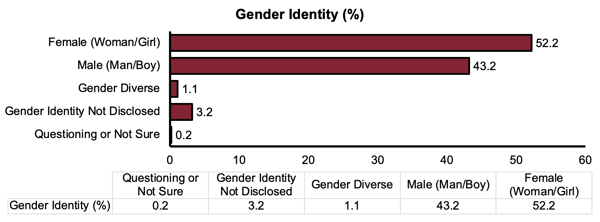
- Question: What is your gender identity?
- Note: the response options for this question were: Female; Male; Prefer to Specify; or Prefer Not to Specify. The response summary listed below is taken from the answers.
- Response Summary: Female (Woman/Girl) (52%); Male (Man/Boy) (43%); and Gender Diverse (1%)
- Question: What is your sexual orientation? Select all that apply.
- Response Summary: Straight/Heterosexual (77%); 2SLGBTQ+ (6%)

- Question: Do you consider yourself to be a person with a disability(ies)? Select one answer only.
- Response Summary: 8% identify as having a disability. Learning, Autism and Mental Health Disabilities are the top three answers.

Question: If you said “Yes, I do consider myself a person with a disability”, select all that apply.

Born in Canada and Status in Canada
- Question: Were you born in Canada?
- Response Summary: 83% born in Canada; 17% born in another country.

- Question: If you were not born in Canada, what is your status in Canada?
- Response Summary: 64% Canadian Citizen; 27% A Landed Immigrant/Permanent Resident; 4% An International Student.

Students' Reflection and Affirmation
- Question: Based on responses to Questions 1-9, do you see yourself reflected and affirmed in your learning through the curriculum and resources?
- Response Summary: 43% Sometimes; 25% Frequently.

- Question: Based on responses to Questions 1-9, do you see yourself reflected and affirmed in your learning through the classroom and school environment?
- Response Summary: 41% Sometimes; 27% Frequently.

Further Student Census Information
- Report to the DCDSB Board of Trustees (January 23, 2023)
- 2021-2022 Student Census Infographic
Contact Us
For more information, please email Equity@dcdsb.ca.